To create a statistical column:
- Click on the Modify Data Source button to show the Select or Modify Data Source dialog
- Click on the Statistical Columns tab
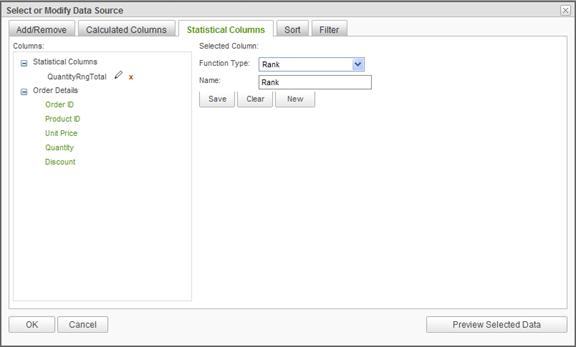
- Choose a function from the Function Type drop-down menu.
- Select a column from the Columns list - the function is applied to the column's value.
- OPTIONAL: Modify the default Name in the field provided.
- Click OK to make the newly created statistical column available for selection in the Report Builder.
|
Notes: |
|
1. When the OK button is clicked the column's name is validated for SQL syntax accuracy. If the name is invalid, then a message will appear. 2. If a statistical column is not used in the report, then it shall be deleted when exiting the Report Builder. Basically, use it or lose it. |
The Rank function ranks data from the lowest value to the highest value. For example, a total of $15.00 would receive a higher rank than a total of $25.00. When one or more data rows have equal values, the rank value is the same for each row. In the following figure, the first five orders listed all have a rank of 1. Since five orders share a rank of 1, the next available rank value is 6.
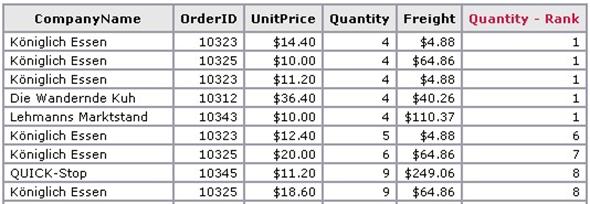
The Quantity - Rank column ranks the Quantity column's value from lowest to highest.
|
Note: |
|
Rank values are never higher than the actual number of rows in the report. |
The Reverse Rank function classifies data from the highest value to the lowest value; a larger value receives a higher rank. For example, a total of $25.00 would receive a higher rank than a total of $15.00. When one or more data rows have equal values, the rank value is the same for each row. In the following figure, the eighth order and subsequent four orders listed all have a rank of 8. Since five orders share a rank of 8, the next available rank value is 13.
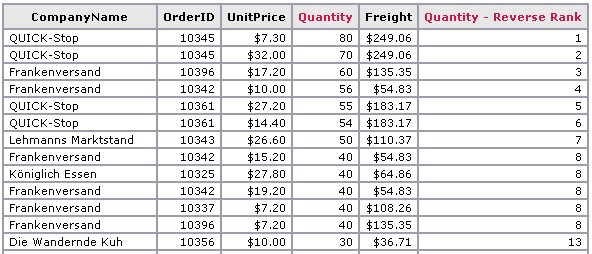
The Quantity - Reverse Rank column ranks data in the Quantity column from highest to lowest.
The Percentile function classifies data based on a percentage of the value distribution. In the following figure, a value equal to or greater than 70 but less than 100 is reported as the 98th percentile.
The Quantity Percentile column ranks data in the Quantity column based on a percentage of the value distribution.
The Running Total function maintains a current total of values provided in the specified column as illustrated in the following figure.
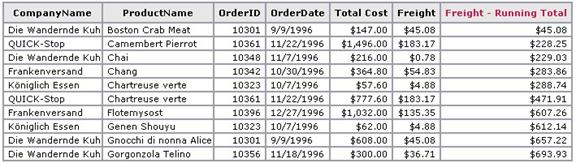
Example use of Running Total based on the Freight column
The Difference from Previous function displays the difference from the current value and the previous value of a specified column. In the following figure, a difference of 31 is reported from rows one to two indicating a gain. A difference of -34 is reported from rows two to three indicating a loss.
The Quantity Difference column maintains the difference from the current value and the previous value of the Quantity column.