Ad Hoc provides two styles of grouped reports - Flat-Table and Drill-Down. The grouped flat-table style organizes records into groups and hides duplicate entries to make the grouped report more presentable. Use the flat-table style to give other users the ability to export the complete report to different formats such as PDF and Excel. The grouped drill-down style organizes records into groups and any remaining columns are included in a sub-report. Use the drill-down style to give other users the ability to hide and show sub-reports.
The feasibility of grouping data highly depends on the data source chosen for the report. A grouped report is not necessarily appropriate when the data is simply a list of customers. If the data source contains information about customers and orders, a grouped report will definitely improve the presentation of the report. The application provides two ways to group data for flat-table and drill-down style reports - multiple grouping columns and multiple layers. Users can combine both methods when creating grouped reports.
Multiple Grouping Layers
Creating grouped reports with multiple layers is useful in scenarios where the report requires more than one grouping to organize all the data.
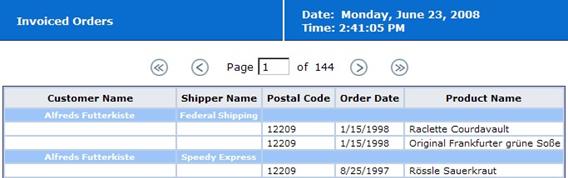
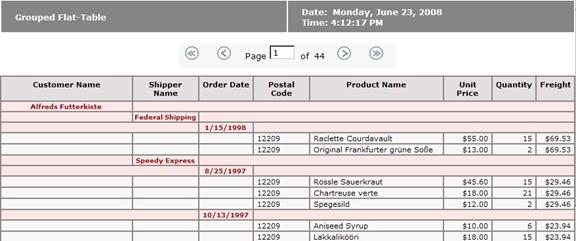
For example, all the customers can be grouped together, and then group by the shipping company and then group by the order date. This scenario is illustrated as a grouped flat-table report and as a grouped drill-down report in the following figures.
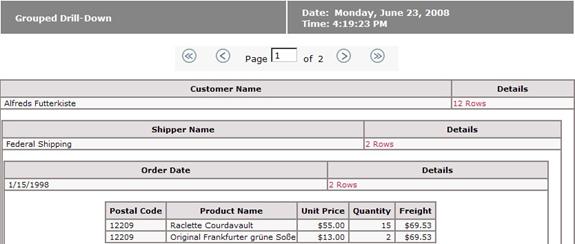
A grouped drill-down report with three grouping layers.
Multi-Column Grouping
Multi-column grouping is useful for displaying more information on a single grouping layer. For example, users can group by customer and then by shipping company, showing both the customer and shipping company on the same layer.
Multiple grouping columns work well with flat-table style reports, since duplicate entries are removed from the final report.
|
|
|
|
|
|
A grouped flat-table report with two grouping columns.
Grouped Flat-Table
The grouping flat-table report style is useful for displaying the entire report in an organized, presentable way.
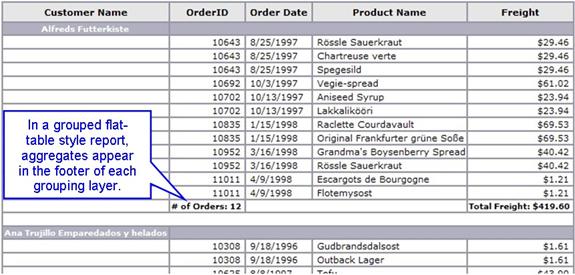
In the following figure, the Customer Name column is the grouping column and any row that contains a group is highlighted. All associated rows for a specific group are displayed beneath the grouping row. Aggregated values for each group are computed and displayed in a separate row.
A grouped flat-table report of customer invoices.
Grouped Drill-Down
The grouped drill-down report offers viewers the ability to control the appearance of the report by hiding and showing sub-reports for each record in the grouping column.
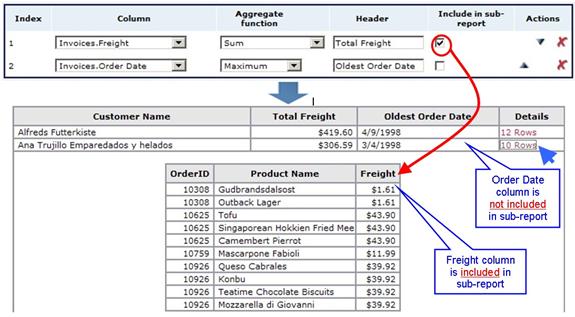
In the following figure, the Customer Name column is the grouping column (always the first column of the main report) and all other columns appear in the sub-report. Users can show/hide sub-reports for each group of records by clicking the hyperlink provided in the Details column. Any additional columns included in the main report are aggregations of a particular column from the sub-report.
A drill-down style report of customer invoices.
|
Note: |
|
Users can disable drill-down functionality for the Details column or hide the column completely. |
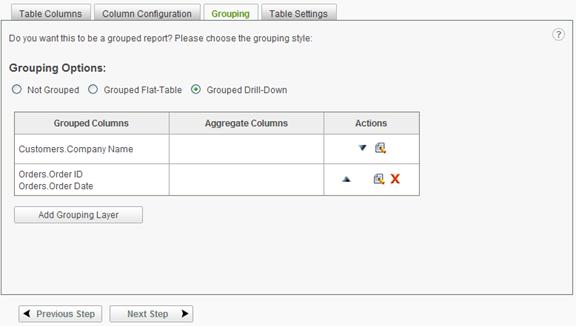
Grouping Layers
Creating and configuring a grouping layer:
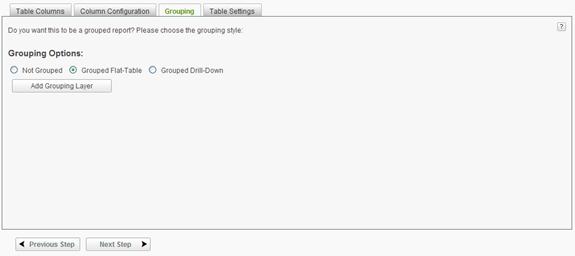
The Grouping tab with the Grouped Flat-Table style selected.
|
Notes: |
|
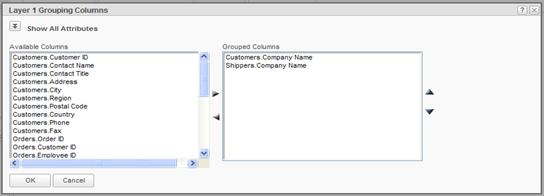
1. The Grouping Layer dialog keeps track of the grouped columns used. 2. The order in which the columns appear in the Grouped Columns list-box dictates the order in which the columns will appear in the report. This display order over-rides that which is specified in the Column Configuration tab. 3. This feature is only offered on the first layer of a grouped flat-table. If the Export to PDF feature is not used in the report, then enabling this feature will not have any effect on the report. |
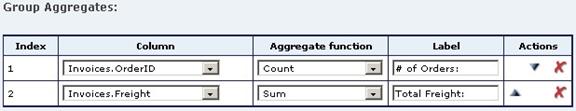
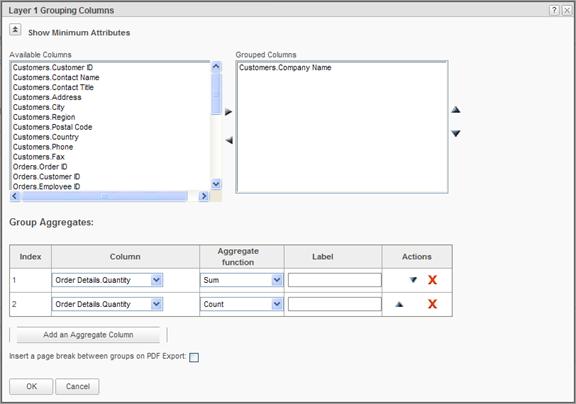
After having added columns to display in the tabular report and after having selected a column(s) to group the layer on, group aggregates can be created.
To create a grouping layer aggregate:
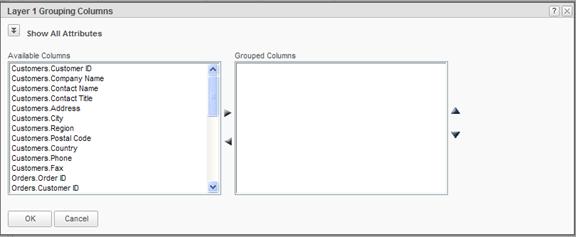
Grouping Columns dialog for a flat-table group
|
Notes: |
|
1. For numeric values, choose aggregations like Sum, Average, Standard Deviation, Count, Count Distinct, Minimum, or Maximum. 2. For text values, Sum and Average are excluded from the list of aggregate functions. Choosing Minimum selects the first alphabetized entry and Maximum selects the last. 3. For date values, Maximum chooses the latest date and Minimum chooses the earliest. |
|
|
|
|
|
|
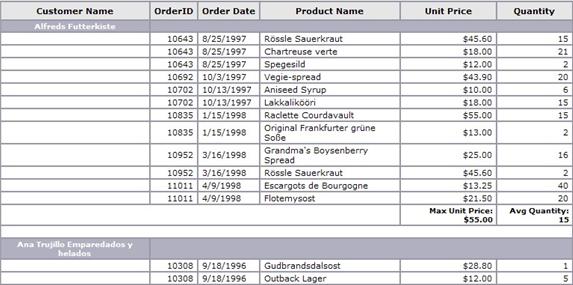
Group aggregates in a flat-table report.
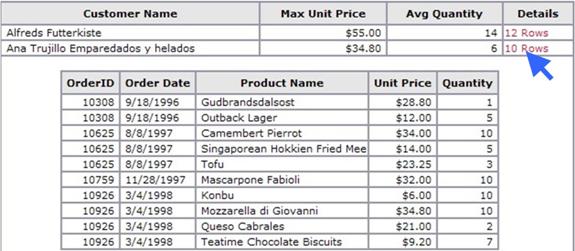
Group aggregates in a drill-down report.
When using the grouped drill-down style, the Grouping Layer dialog presents different options.
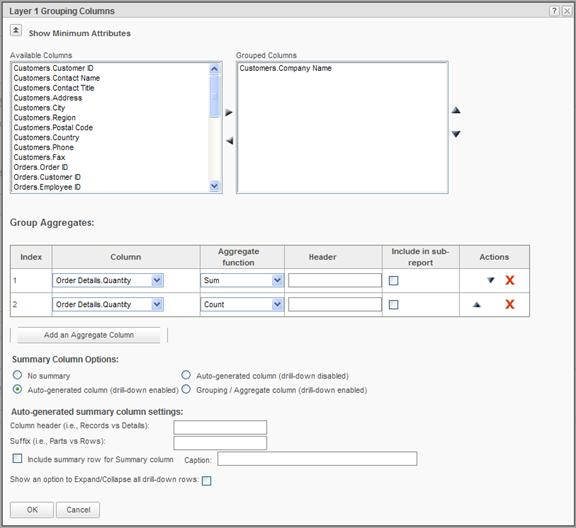
Grouping Columns dialog for a drill-style group
The Summary Column Options are described in the following table.
|
Option |
Behavior |
|
No summary |
The report is rendered without a Details column and no means to drill-down to the sub-report. |
|
Auto-generated column (drill-down enabled) |
|
|
Auto-generated column (drill-down disabled) |
|
|
Grouping / Aggregate column |
|
When one of the auto-generated column display options is selected, the following options may be applied to the summary column:
To configure a grouped drill-down's Details column options:
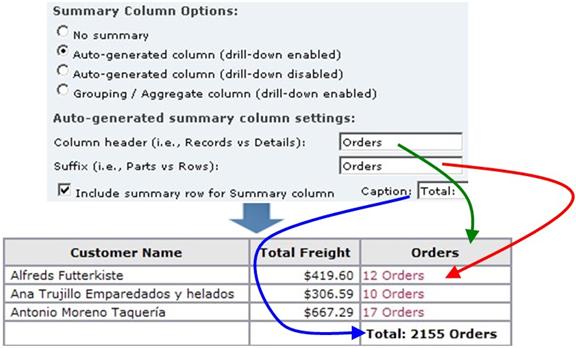
Grouped drill-down report with customized Details column heading, suffix and summary row
The application supports an unlimited number of grouping layers for any single report. Each layer can have multiple grouped columns, including any number of group aggregates.
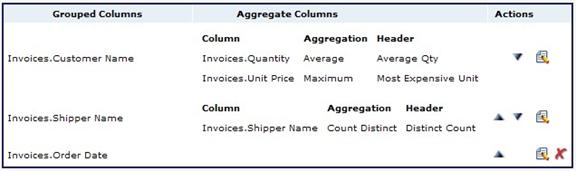
Grouped drill-down report with three grouping layers
To modify a grouping layer (all options):
i. Modify the Header.
ii. Enable or disable the Include in sub-report option to include or not include the column in the sub-report.
i. Type an alternate Column header name for the summary column in the field provided.
ii. Type an alternate Suffix name for the summary hyperlink in the field provided.
To delete a grouping layer: